Unified Storage, Unlocked: SAN/NAS/Object Made Simple


In today's rapidly evolving data landscape, businesses are constantly seeking ways to optimize their IT infrastructure, reduce complexity, and enhance operational efficiency. Storage, a critical component of any IT environment, often presents a significant challenge. Traditional storage solutions typically involve separate systems for block-level data (SAN - Storage Area Network), file-level data (NAS - Network Attached Storage), and object storage leading to siloed environments, increased management overhead, and higher costs. But what if you could consolidate these disparate systems into a single, unified platform?

This guide will show you how to conquer storage complexity and why a unified SAN, NAS and Object Storage solution is the key to a more efficient, powerful, and streamlined IT environment.

Understanding SAN, NAS and Object: The Traditional Divide

Before diving into the benefits of unified storage, let's briefly define the three primary storage architectures:

•Storage Area Network (SAN): A high-speed network that provides block-level access to data. SANs are typically used for applications requiring high performance and low latency, such as databases, virtualized environments, and mission-critical applications. Data is accessed as raw blocks, similar to how a local hard drive is accessed.

•Network Attached Storage (NAS): A file-level data storage server connected to a computer network that provides data access to a heterogeneous group of clients. NAS is ideal for file sharing, file collaboration, archives. Data is accessed as files and folders over standard network protocols like NFS or SMB.

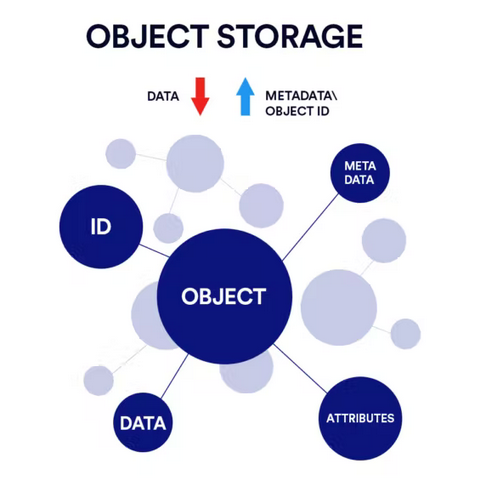
•Object Storage: Object storage stores data as objects instead of files or blocks. Each object has data, metadata, and a unique identification for easy retrieval. Object storage is flat and scalable. Mainly used to store and access unstructured data such as video and audio files, IoT data, etc.

Want a quick primer? See NFS and SMB background reading on Wikipedia: NFS andWikipedia: SMB.

Why Separate SAN, NAS and Object Storage Systems Are Holding You Back

Traditionally, organizations would deploy separate SAN, NAS and object storage systems to meet their diverse storage needs. This often resulted in increased hardware costs, complex management interfaces, and inefficient resource utilization. As data demands grow, this legacy approach creates more problems than solutions. Here are the reasons why it's time to rethink:

  • Increased Hardware & Capital Costs
    Maintaining distinct SAN, NAS and object storage systems often means duplicated infrastructure—extra servers, storage units, and networking gear. This drives up CAPEX and leads to underutilized assets.

  • Complex Management & Silos
    Each system typically comes with its own management interface, requiring specialized skillsets and additional training. Admins waste time toggling between platforms, increasing the risk of errors.

  • Inefficient Resource Utilization
    Resources are locked into separate storage pools. When one system is underused and the other is at capacity, you can’t shift resources easily—leading to waste and bottlenecks.

  • Scalability Challenges
    Scaling SAN, NAS and Object storage independently requires different tools, processes, and sometimes vendors. This not only adds cost but also disrupts operational agility.

  • Security & Compliance Gaps
    Three systems mean three sets of security protocols and backup policies, which can result in inconsistent data protection strategies—and compliance risks.

  • Maintenance Overhead
    Managing firmware updates, patches, and performance tuning on three different platforms increases operational overhead and downtime exposure.

  • Limited Visibility & Analytics
    Siloed systems provide fragmented data insights, making it hard to get a unified view of storage health, capacity trends, and performance analytics.

  • Inflexibility for Hybrid Workloads
    Today’s workloads span everything from VMs and containers to unstructured media. Traditional setups lack the flexibility to support both block, file, and object on the same architecture—without trade-offs.

The Advantages of Unified SAN, NAS and Object Storage

The concept of unified storage delivers a multitude of benefits that directly address the pain points of modern IT environments:

  1. Reduced Management Complexity: By consolidating SAN, NAS, and Object Storage into a single system, unified storage significantly simplifies management. Instead of juggling multiple interfaces and separate management tools, IT teams can oversee their entire storage infrastructure from a single pane of glass. This streamlines operations, reduces the learning curve for new administrators, and frees up valuable IT resources.
  • Improved Operational Efficiency: A unified system leads to better resource utilization. Storage capacity can be dynamically allocated to either block, file or object workloads as needed, eliminating wasted space and optimizing performance. This flexibility ensures that your storage resources are always aligned with your business demands, leading to greater efficiency and cost savings.
  • Elimination of Siloed Systems: The traditional approach of separate SAN, NAS and object storage creates data silos, making data sharing and collaboration challenging. A unified platform breaks down these barriers, fostering a more integrated and collaborative data environment. This is crucial for modern applications and workflows that often require access to both block and file data.
  • Flexibility for Diverse Workloads: The ability to handle both block, file, and object data on a single platform provides unparalleled flexibility. You can support high-performance databases and virtual machines (block-level access) alongside large file shares and unstructured data (file-level access) and API driven object storage without compromising performance or efficiency. This adaptability makes unified storage an ideal solution for a wide range of enterprise and SMB workloads.
  • Enhanced Performance and Reliability: Unified storage solutions are designed to ensure optimal performance for all workloads. Their architecture is built to deliver high throughput and low latency, crucial for demanding applications. The system's inherent reliability and data protection features further safeguard critical business data.


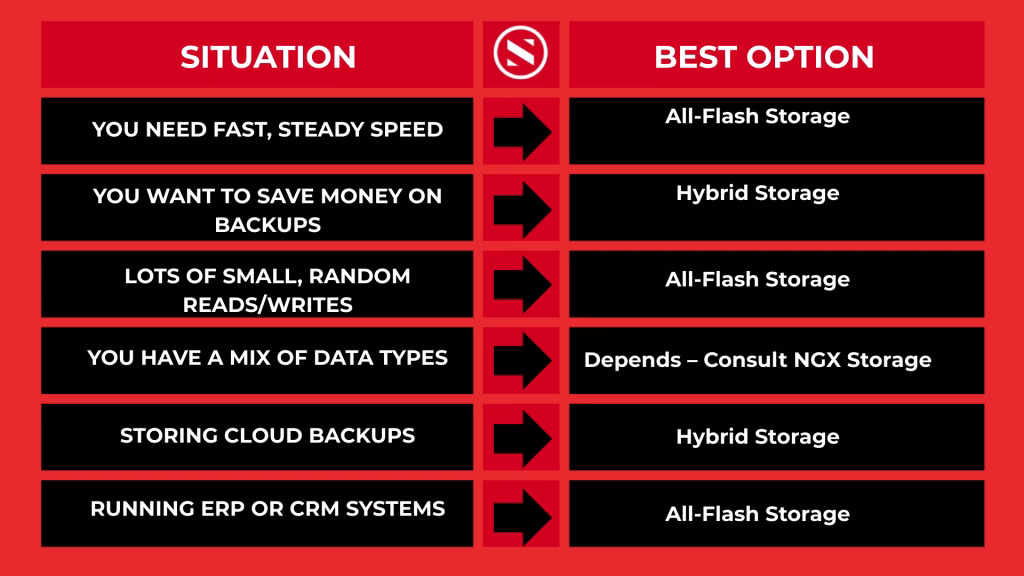
SAN vs NAS vs Object vs Unified

SAN (block): Low‑latency LUNs for databases/VMs.

NAS (file): NFS/SMB shares for collaboration and multi user access.

Object: Flat architecture for unstructured data with metadata.

Unified: One system exposing block + file + object with shared services, policy, and analytics.


NGX Storage: Delivering Unified Power

Recognizing the value of unified storage is an important first step. But true progress comes from aligning that understanding with a solution built on reliability, clarity, and purpose. NGX Storage brings those principles together in a system designed to meet the operational realities of modern IT environments.

Here’s how NGX contributes to a more cohesive and efficient storage infrastructure:

🔗 Unified Support for Block, File, and Object Protocols

NGX combines Fibre Channel, iSCSI, NFS, SMB, and S3 protocols into a single system. This allows you to support a wide range of workloads without maintaining separate infrastructure for each.

⚙️ Balanced Performance Across Workloads

Whether you're running high-throughput databases or managing large shared file environments, NGX is built to handle both efficiently—without forcing trade-offs between speed and stability.

📊 Intelligent Resource Management

Unified storage offers management with logical isolation and QoS to prevent noisy‑neighbour effects, ensuring that one doesn’t impact the other. Workloads remain consistent, with resources optimized based on usage patterns.

🖥️ Streamlined Interface for Everyday Tasks

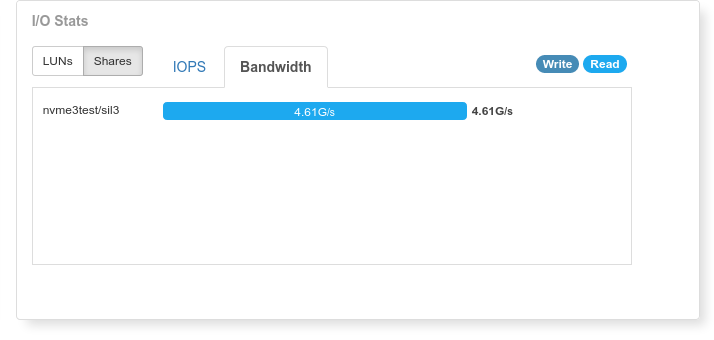
NGX’s GUI is straightforward, enabling IT teams to create LUNs, file shares, and buckets quickly, monitor usage, and manage storage without complexity.


Next Step: Bring Clarity to Storage Complexity

Modern IT environments demand solutions that are both capable and clear. If managing separate systems has created more friction than value, it may be time for a change.

NGX Storage offers a thoughtful, unified approach—built not just to perform, but to simplify. No overhauls. No unnecessary complexity. Just a better way to manage what matters.

Explore your options with confidence. Reach out for a free consultation, request a low‑risk assessment and capacity plan, and see how NGX can help streamline your storage strategy.

Unlock Hidden Value: Maximizing ROI with NGX Intelligent Storage Analytics

NGX Storage Predictive Smart Analytics banner showing a data-driven executive overlooking a city skyline with digital dashboards. Text overlay reads 'Predictive Smart Analytics: Turning Storage Insight into Profit'.


“Data is a precious thing and will last longer than the systems themselves.” — Tim Berners-Lee

In today’s digital economy, data isn’t just valuable; in fact, it’s foundational. Every modern system, from AI workflows to hybrid cloud environments, depends on reliable, responsive, and intelligent storage. Yet for too long, storage has been treated as a passive resource.

NGX Smart Analytics changes that. By turning raw storage telemetry into predictive insight, it helps businesses avoid outages, optimize performance, and reduce operational risk—before problems ever occur.

In this guide, we’ll explore how NGX transforms your storage infrastructure into a strategic advantage.


Why Predictive Storage Analytics Is Essential for Modern IT

Predictive analytics in storage is no longer optional—it’s strategic. According to Market Research Future:

“The global predictive analytics market is projected to grow at a CAGR of 21.7% from 2022 to 2030.”
— Market Research Future, Predictive Analytics Market Forecast

This growth reflects a broader shift: IT teams are moving from reactive troubleshooting to proactive performance and risk management.

Today’s infrastructure spans cloud, on-premises, and edge systems. As a result, without visibility across environments, issues often go undetected, SLAs are harder to meet, and capacity planning becomes guesswork. Predictive storage analytics changes that—offering insight before issues arise, and control before performance suffers.

What NGX Smart Analytics Delivers:

Clarity Before It’s Critical
Predictive dashboards highlight usage patterns and IO trends before they become bottlenecks—giving teams weeks of foresight, not minutes of warning.

Root-Cause Detection in Real Time
When performance dips, NGX pinpoints the exact volume or share behind the slowdown using visual heatmaps and smart alerts—cutting troubleshooting from hours to minutes.

Proactive Hardware Health Monitoring
From fans and DIMMs to SSDs and power supplies, NGX identifies failing components before users feel the impact—helping you stay ahead of potential outages.

Consistent, SLA-Driven Data Delivery
Continuous optimization ensures your workloads meet performance targets, even under changing demand—so your business stays responsive and reliable.

These capabilities form the foundation of a modern IT strategy—one built on proactive insight, not reactive recovery.


Inside NGX Smart Analytics

NGX Smart Analytics is designed to turn visibility into action. More importantly, it enables preventive action rather than reactive fixes.

The Six Pillars of Smarter Storage

A 3D circular chart titled "The Six Pillars of NGX Smarter Storage" with six coloured segments representing the core features: Smart Statistics, Anywhere Access, Expert-Guided Support, Foresee & Prevent, Deep Usage Analysis, and Always-On Maintenance.


1.Foresee & Prevent

Stay ahead of problems before they happen. To begin with, NGX keeps a constant watch on your infrastructure, analyzing millions of telemetry points every hour. Whether it's early NAND fatigue, write amplification, or thermal imbalance, NGX sends timely alerts and clear action plans. As a result, your systems stay healthy and downtime is avoided.

2. Smart Statistics

In other words, numbers only help if they make sense. NGX turns raw data into clear, usable insights. With the help of intuitive dashboards, color-coded heatmaps, and usage graphs, you can easily spot issues, identify patterns, and make smarter decisions—no guesswork needed.

3. Anywhere Access

No matter where you are—at the office, working remotely, or on the go—NGX gives you secure access to your system insights. It’s built for distributed teams and hybrid setups, offering role-based dashboards on any device. Because of this, you stay informed and in control, anytime and anywhere.

4. Deep Usage Analysis

To truly understand how your storage is used, you need deep insights. NGX tracks everything from block size to growth patterns. This means you can optimize for performance, forecast your needs accurately, and fine-tune workloads based on how your applications actually behave.

5. Expert-Guided Support

When there’s a problem, you need real answers—fast. NGX doesn’t leave you with bots or scripts. Instead, it flags issues through AI and connects you directly to experienced engineers. As a result, you get personalized, expert support when it matters most.

6. Always-On Maintenance

Finally, NGX works quietly in the background to keep your systems healthy. Through real-time checks, automated diagnostics, and proactive maintenance, it prevents problems before they impact performance. This lets your IT team focus on growth, not firefighting.

Quick Start: Smarter Storage in Under 90 Minutes

Setting up NGX Smart Analytics is fast, secure, and non-disruptive. In fact, it’s designed to deliver insights without interfering with your day-to-day operations.

To get started, just log in to the NGX Storage web interface, activate the Call Home Service, and enter your account credentials. Within minutes, the system begins sending encrypted telemetry to NGX’s cloud—with no reboots, no downtime, and zero impact on performance.

In short, it’s a low-effort step that unlocks high-impact insight.

Unlike other tools, NGX doesn’t demand complex setup or long onboarding. Instead, it begins delivering value from day one—with just a few clicks.


Future-Proof Your Storage Investment with Insight and Strength

Data powers your business—but only if your infrastructure is ready for what’s next. As environments grow more complex, and expectations rise, reactive strategies fall short.

NGX Smart Analytics helps you shift from managing risk to mastering it. By turning storage telemetry into early warnings and actionable insight, it ensures your systems run predictably—even under unpredictable conditions.

Whether you're scaling AI workloads, supporting hybrid cloud, or simply keeping critical apps online, NGX helps you:

  • Anticipate issues before they become failures
  • Avoid costly downtime with intelligent prevention
  • Meet SLAs with confidence—even under pressure
  • Unlock performance and efficiency hidden in your environment

This isn’t just about monitoring—it’s a thoughtful, insight-driven approach to storage, designed to support long-term stability, clarity, and growth.


Ready to Step Into Smarter Analytics?

Understanding your infrastructure shouldn’t require guesswork.

NGX Smart Analytics helps you surface the patterns, risks, and usage behaviors that matter—so you can make decisions based on facts, not assumptions.

Setup is simple. Insights begin almost immediately.

👉 Start your 14-day trialwww.ngxstorage.com/get-started

🕒 Fast, secure setup
🔒 No disruption to existing systems
📊 Clear, practical insight from day one

Sometimes, a clearer view is all it takes to move forward with confidence.


FAQs

Q1: How is data secured?
All telemetry is anonymised, encrypted (TLS 1.3 in flight, AES 256 at rest), and processed in ISO‑27001 certified facilities. Role‑based access ensures only authorised staff view dashboards.

Q2: What if I already have a third‑party monitoring suite?
NGX exports metrics through REST APIs, allowing you to embed predictions and capacity forecasts into existing NOC views.

Q3: What is analytics storage?
Analytics storage refers to the system or environment where analytical data—such as logs, metrics, and usage patterns—is collected, stored, and processed. It enables organisations to monitor system performance, detect issues, and make data-driven decisions. Analytics storage can be on-premises or cloud-based and is often used with business intelligence (BI) or observability tools.

The Ultimate Guide to All-Flash vs. Hybrid Storage


Choosing between all-flash and hybrid flash storage is a critical choice for any business that uses a lot of data. As we move deeper into 2025, understanding the pros and cons of each type helps IT teams make better decisions. This post will explain what each system (all-flash array & hybrid flash storage) does well and how NGX Storage can help boost your business through expert guidance, 7/24 fast support, and high-performance storage solutions.


What Is an All-Flash Storage (AFA)?

An all-flash storage array is a system that stores all data on solid-state drives (SSDs), typically NVMe or SAS. The absence of spinning disks ensures faster data access and reduced power consumption. Most AFAs use NVMe or SAS SSDs.

This system is built to give fast speed, quick access to data, and steady performance.

Advantages:

  • Very fast (sub-millisecond delay)
  • High speed read and write (IOPS)
  • Uses less power and cooling
  • Works great for AI, virtual desktops (VDI), and apps with heavy use

Drawbacks:

  • Higher cost per TB


What is Hybrid Storage?

Hybrid storage systems use both solid-state drives (SSDs) and hard disk drives (HDDs). SSDs handle active or frequently used data, while HDDs store less-used data. This tiered model balances performance and cost-efficiency, making it attractive for organizations with lots of different data types.

Advantages:

  • More affordable for large data needs
  • Sufficient performance for mid-tier workloads

Drawbacks:

  • Slower and less steady performance than all-flash systems
  • Consumes more energy and has higher cooling costs, which increases overall expenses.


All-flash Array vs. Hybrid Flash Storage: Which One Is Right For You?


All-Flash Storage vs. Hybrid Storage: When to Choose Which?


How NGX Storage Makes Storage Even Better

At NGX Storage, we’ve taken hybrid flash storage to the next level with a smart and powerful design.

Our system uses DRAM-first architecture, which means it stores most recent data in super-fast memory — up to 8TB of DRAM cache. This helps your apps run faster and smoother, with ultra-low latency.

We also use a unique method called Random Flash Sequential Disk. Here's how it works:

  • Random data goes to high-speed flash (SSD)
  • Sequential data goes to large-capacity hard drives (HDD)

This smart flow gives you the speed of flash with the cost savings of disk, all in one system.

NGX also uses a flash tier to store important metadata, like a smart index that helps the system find files quickly. By keeping this info in fast SSDs, apps load faster and storage stays responsive, even during heavy use. This works hand in hand with our DRAM cache to give you smooth, high-speed performance every time.


Why choose NGX?

  • ⚡ Lightning-fast performance where it matters.
  • 📉 Petabyte-scale performance, without overspending.
  • 🤝 Trusted expertise with rapid-response support you can count on.
  • 🚀 Engineered for excellence. Trusted by industry leaders powering mission-critical operations.

Whether you're powering databases, backups, or cloud systems — NGX ensures enterprise-class reliability and speed backed by expert support, without compromise.


Next Steps

Want to experience how NGX combines speed, smart caching, and scale in one powerful system? Contact our team today to book a live demo here and discover how NGX can transform your storage infrastructure with performance you can feel.

Optimizing PostgreSQL Backups with NGX Storage and pgBackRest

pgs

When it comes to PostgreSQL backups, efficiency, reliability, and scalability are key priorities. Combining the advanced capabilities of pgBackRest with the robust features of NGX Storage, a unified storage solution, offers a powerful approach to safeguarding your PostgreSQL databases. This combination simplifies backup workflows, enhances performance, and ensures your data is always secure and accessible.

Why PostgreSQL Backups Need a Modern Approach

PostgreSQL databases power critical applications across industries, making reliable backups essential. Traditional backup methods often struggle with scalability, complexity, and performance, especially as database sizes grow. Modern tools like pgBackRest address these challenges by enabling:

  • Full, differential, and incremental backups.
  • Parallel processing for faster operations.
  • End-to-end encryption for enhanced security.

By pairing pgBackRest with NGX Storage, organizations can further optimize backup strategies, benefiting from unified storage that supports diverse protocols and delivers high performance.

The Advantages of Using NGX Storage for PostgreSQL Backups

NGX Storage is more than just a backup destination—it’s a unified storage solution that integrates seamlessly with PostgreSQL backup tools like pgBackRest. Here’s why it stands out:

1. Scalable and Flexible Backup Storage

NGX Storage grows with your PostgreSQL databases, supporting large-scale backups without requiring complex reconfigurations.

2. Reliability and Redundancy

Built-in redundancy ensures that your PostgreSQL backups remain safe and available, even in the event of hardware failures.

3. Seamless Integration with pgBackRest

pgBackRest’s compatibility with NGX Storage enables high-performance backups and restores, making it easy to implement advanced backup workflows.

4. Cost Efficiency Through Unified Storage

NGX Storage consolidates multiple storage types—block, file, and object—into one system, reducing overhead and simplifying management.

5. Enhanced Security for Backup Data

With encryption, access control, and immutable snapshot capabilities, NGX Storage ensures your PostgreSQL backups are protected from unauthorized access or accidental loss.

Boosting Backup Efficiency with pgBackRest and NGX Storage

When configured together, pgBackRest and NGX Storage deliver unmatched efficiency for PostgreSQL backups:

  • Fast Backups: Parallel processing in pgBackRest accelerates backup operations, while NGX Storage ensures low-latency access.
  • Incremental Storage Savings: Combined with pgBackRest’s differential backups, NGX Storage optimizes space usage, storing only changes rather than full datasets.
  • Reliable Restores: Backups stored on NGX Storage are quickly accessible for disaster recovery, ensuring minimal downtime.

Explore More: Using pgBackRest with NGX Storage

For a detailed guide on configuring and using pgBackRest with NGX Storage S3 for PostgreSQL Backups, check out our comprehensive knowledge base article.

Why PostgreSQL Users Choose pgBackRest and NGX Storage

For PostgreSQL database administrators, the combination of pgBackRest and NGX Storage is a game-changer. It offers a streamlined approach to managing backups, from regular operations to large-scale recovery scenarios. Whether you need to protect mission-critical databases or ensure compliance with data retention policies, this duo provides the tools and performance you need.

Final Thoughts

Efficient PostgreSQL backups are vital for maintaining data integrity and availability. By integrating pgBackRest with NGX Storage, organizations can leverage a unified storage platform that enhances backup and restore processes while delivering scalability, reliability, and cost efficiency.

If you’re ready to optimize your PostgreSQL backup strategy, explore how pgBackRest and NGX Storage can help you achieve faster, more reliable, and secure backups.

Don’t let outdated backup systems hold you back—transform your PostgreSQL backup workflow today.

Improving NFS Read Performance: Overcoming Protocol Stack Challenges

Optimizing Network File System (NFS) performance can be a challenging task that requires a nuanced understanding of protocol dynamics. The main challenge is using a standard TCP socket for communication between the client and server, which adds complexity to the protocol stack.

Even when network links have substantial bandwidth headroom, NFS client performance tends to plateau. Read operations achieve throughputs of around 2GB/sec, while write operations achieve throughputs of around 1.2GB/sec on a single mount. The performance bottleneck is not caused by traditional suspects such as operating system or CPU limitations, but rather by the complexities intrinsic to the NFS protocol stack.

Linux now has a new feature called 'nconnect' which allows for multiple TCP connections to be established for a single NFS mount. By setting nconnect as a mount option, the NFS client can open multiple transport connections for the same host. This feature is included in Linux kernel versions 5.3 and above.

Using 'nconnect' is sama as other options;


mount -t nfs -o rw,nconnect=16 192.168.1.1:/exports/ngxpool/share /mnt


Let's examine a performance comparison from a single host using NGX Storage:

Our test setup involves a single client with a 40 Gbit ethernet connection connected to a switch for NFS testing. This configuration aims to assess system performance and data exchange capabilities in a straightforward manner.

Case 1: Without "nconnect"


root@proxmox:~# fio --rw=read --ioengine=libaio --name=test_nconncect-1 --size=20g --direct=1 --invalidate=1 --fsync_on_close=1 --norandommap --group_reporting --exitall --runtime=60 --time_based --iodepth=128 --numjobs=1 --bs=128k --filename=/mnt/test
test_nconncect-1: (g=0): rw=read, bs=(R) 128KiB-128KiB, (W) 128KiB-128KiB, (T) 128KiB-128KiB, ioengine=libaio, iodepth=128
fio-3.25
Starting 1 process
Jobs: 1 (f=1): [R(1)][100.0%][r=1221MiB/s][r=9767 IOPS][eta 00m:00s]
test_nconncect-1: (groupid=0, jobs=1): err= 0: pid=60345: Fri Feb 2 17:04:57 2024
read: IOPS=11.0k, BW=1496MiB/s (1568MB/s)(87.7GiB/60012msec)
slat (usec): min=12, max=286, avg=24.59, stdev= 9.19
clat (usec): min=2824, max=28405, avg=10670.42, stdev=1509.28
lat (usec): min=2892, max=28439, avg=10695.08, stdev=1509.38
clat percentiles (usec):
| 1.00th=[ 8717], 5.00th=[ 8979], 10.00th=[ 9110], 20.00th=[ 9372],
| 30.00th=[ 9634], 40.00th=[ 9896], 50.00th=[10159], 60.00th=[10552],
| 70.00th=[11207], 80.00th=[12125], 90.00th=[13173], 95.00th=[13304],
| 99.00th=[14615], 99.50th=[15139], 99.90th=[16581], 99.95th=[17433],
| 99.99th=[23462]
bw ( MiB/s): min= 1189, max= 1577, per=100.00%, avg=1495.81, stdev=119.18, samples=120
iops : min= 9518, max=12618, avg=11966.47, stdev=953.42, samples=120
lat (msec) : 4=0.01%, 10=42.86%, 20=57.11%, 50=0.03%
cpu : usr=3.26%, sys=31.89%, ctx=715792, majf=0, minf=4112
IO depths : 1=0.1%, 2=0.1%, 4=0.1%, 8=0.1%, 16=0.1%, 32=0.1%, >=64=100.0%
submit : 0=0.0%, 4=100.0%, 8=0.0%, 16=0.0%, 32=0.0%, 64=0.0%, >=64=0.0%
complete : 0=0.0%, 4=100.0%, 8=0.0%, 16=0.0%, 32=0.0%, 64=0.0%, >=64=0.1%
issued rwts: total=718115,0,0,0 short=0,0,0,0 dropped=0,0,0,0
latency : target=0, window=0, percentile=100.00%, depth=128

Run status group 0 (all jobs):
READ: bw=1496MiB/s (1568MB/s), 1496MiB/s-1496MiB/s (1568MB/s-1568MB/s), io=87.7GiB (94.1GB), run=60012-60012msec


nfs_nconnect_1


Case 2: With "nconnect"


root@proxmox:~# fio --rw=read --ioengine=libaio --name=test_nconncect-16 --size=20g --direct=1 --invalidate=1 --fsync_on_close=1 --norandommap --group_reporting --exitall --runtime=60 --time_based --iodepth=128 --numjobs=2 --bs=128k --filename=/mnt/test
test_nconncect-16: (g=0): rw=read, bs=(R) 128KiB-128KiB, (W) 128KiB-128KiB, (T) 128KiB-128KiB, ioengine=libaio, iodepth=128
...
fio-3.25
Starting 2 processes
Jobs: 2 (f=2): [R(2)][100.0%][r=4707MiB/s][r=37.7k IOPS][eta 00m:00s]
test_nconncect-1: (groupid=0, jobs=2): err= 0: pid=66333: Fri Feb 2 17:45:55 2024
read: IOPS=37.6k, BW=4705MiB/s (4934MB/s)(276GiB/60007msec)
slat (usec): min=9, max=849, avg=25.58, stdev=11.04
clat (usec): min=2452, max=18476, avg=6774.13, stdev=1787.08
lat (usec): min=2470, max=18507, avg=6799.76, stdev=1787.05
clat percentiles (usec):
| 1.00th=[ 5276], 5.00th=[ 5473], 10.00th=[ 5538], 20.00th=[ 5604],
| 30.00th=[ 5735], 40.00th=[ 5800], 50.00th=[ 5866], 60.00th=[ 6063],
| 70.00th=[ 7308], 80.00th=[ 7570], 90.00th=[11076], 95.00th=[11338],
| 99.00th=[11600], 99.50th=[11731], 99.90th=[11863], 99.95th=[11994],
| 99.99th=[12125]
bw ( MiB/s): min= 4683, max= 4712, per=100.00%, avg=4706.41, stdev= 1.68, samples=238
iops : min=37466, max=37700, avg=37651.29, stdev=13.48, samples=238
lat (msec) : 4=0.01%, 10=88.73%, 20=11.26%
cpu : usr=2.67%, sys=50.41%, ctx=994400, majf=0, minf=20609
IO depths : 1=0.1%, 2=0.1%, 4=0.1%, 8=0.1%, 16=0.1%, 32=0.1%, >=64=100.0%
submit : 0=0.0%, 4=100.0%, 8=0.0%, 16=0.0%, 32=0.0%, 64=0.0%, >=64=0.0%
complete : 0=0.0%, 4=100.0%, 8=0.0%, 16=0.0%, 32=0.0%, 64=0.0%, >=64=0.1%
issued rwts: total=2258833,0,0,0 short=0,0,0,0 dropped=0,0,0,0
latency : target=0, window=0, percentile=100.00%, depth=128

Run status group 0 (all jobs):
READ: bw=4705MiB/s (4934MB/s), 4705MiB/s-4705MiB/s (4934MB/s-4934MB/s), io=276GiB (296GB), run=60007-60007msec


nfs_nconnect_16

In conclusion, implementation of the 'nconnect' feature in Linux kernel 5.3 and above serves as a functional solution, allowing for multiple TCP connections for a single NFS mount. The assessment, based on fio tests and NGX Storage metrics, underscores 'nconnect' as a practical tool for enhancing performance.

NOTE: Do not enable blindly this feature ! Read your NFS client documentation to confirm whether nconnect is supported in your client version and their best practises.

Protect Your Data against Ransomware with NGX Storage Safe Mode

res-ransomwa

In the complex landscape of cybersecurity, the looming threat of ransomware grows larger, targeting data storage systems with potentially severe consequences. Amid this danger, the NGX safe storage mode emerges as a vital shield, offering a simple and reliable defense against the potential damage caused by ransomware attacks.

Ransomware, a harmful form of cyber threat, has expanded into data storage systems, casting a shadow of disruption and data loss over important information repositories. As attackers evolve tactics, organizations managing storage must strengthen defenses and establish security measures to protect against ransomware. A powerful defense lies at their disposal: the NGX safe storage mode, providing an accessible and effective way to prevent the impact of ransomware.

What is Ransomware Attack

A ransomware attack is a malicious cyberattack in which an unauthorized actor encrypts a victim's computer files, data, or system, making them inaccessible. The attacker demands a ransom, usually in cryptocurrency, in exchange for a decryption key to unlock the data. Ransomware attacks can lead to data loss, financial losses, and operational disruption, posing a cybersecurity concern across industries.

Ransomware attacks on storage devices follow a similar principle to those on individual computers or networks, but they target data stored within storage systems. Here's how a ransomware attack can occur on a storage device:

  1. Ransomware gains access to stored data through deceptive emails, compromised websites, or software vulnerabilities.
  2. The ransomware encrypts victim's files or storage systems upon intrusion, making the data inaccessible without a decryption key.
  3. Attackers demand payment in cryptocurrency, threatening permanent data loss if not paid.
  4. Ransomware can spread to other connected devices, increasing the attack's impact.
  5. Paying the ransom may provide a decryption key, but data integrity may still be compromised.


How to prevent it with NGX Safe Storage Mode

NGX Storage systems offer a defense mechanism through safe mode on volumes, preventing unauthorized intrusions to delete volumes or snapshots. This proactive approach secures NGX Storage environments by maintaining locked snapshots and volumes, enhancing resilience against threats.

Safe mode, once activated with a designated retention period, can only be deactivated through NGX Storage Support, adding an extra layer of security. Immutable snapshots within NGX Storage systems play a key role in data integrity and recovery, providing an unchangeable state of stored data at a specific time. They safeguard against data loss, malicious actions, or system failures.

The NGX Safe Storage mode enhances protection by securing not just volumes, but also associated snapshots. Activation creates a barrier against attempts to delete volumes and snapshots, ensuring data remains intact even against intrusion.

To learn how to activate storage safe mode you can check our kb article.

Data Protection Reinforced with Veeam Backup and NGX Storage Partnership

ngxstorage_veeam

Veeam, a leading provider of data management and protection software solutions, offers a comprehensive range of virtual, physical, and cloud environment solutions. These solutions aim to ensure the availability and recoverability of organizations' data, applications, and systems. One of Veeam's core functionalities is its ability to create and manage repositories for storing backup data.

Veeam's repository solutions provide organizations with the flexibility to store backups on a variety of storage platforms, including local storage, network-attached storage (NAS), and object storage. NGX Storage, a provider of enterprise-class storage solutions, is designed to meet the needs of organizations of all sizes, with a focus on performance, scalability, and reliability. As a result, NGX Storage's solutions are the ideal choice for use as a storage target for backup workloads.

NGX Storage has been recognized by Veeam for its compatibility with Veeam Backup and Replication, as it has been accredited in both the Veeam Ready-Repository and Veeam Ready Object categories. This accreditation indicates that NGX Storage's solutions have undergone rigorous testing and have been deemed fully compatible with Veeam's data management and protection software as a file, block or object storage target.

By combining the capabilities of Veeam Backup and Replication and NGX Storage, organizations can experience an elevated level of data protection. This partnership results in lightning-fast data transfer speeds, substantial time savings during each virtual machine backup, and the assurance of utilizing established backup procedures, all while benefiting from NGX Storage's advanced storage services, protocols, performance, and data protection features. It is a partnership that provides a multitude of advantages.

Comparing iSCSI vs Fibre Channel Storage Network

netblogdata

As we know, nowadays the network speed has reached 400G at data centers. And, most servers are coming with at least 25G or 50G network adaptors now as a default configuration. This fact brings challenging questions from our customers and we are facing  iSCSI vs Fibre Channel storage network comparisons. Of course, priority is being competitive at the business and catching the future trends.

Before continuing, we assume you are familiar with block storage technologies. However, if you want a brief history of these protocols you can check one of the best technical deep-dive webcast about Fibre Channel and iSCSI comparison by SNIA.

Let's focus on our main subject here; performance and cost!

First of all, we prepared a testbed to compare apples to apples. This is a very important point to highlight our decision. Because we see lots of non-comparable test scenarios on the internet, I mean apples to oranges. For example, comparing 1G iSCSI vs 8G Fibre Channel. Also, we know Fibre Channel networks are dedicated over SAN switches but somehow iSCSI tests are conducted on a shared backbone or edge switches. Similarly comparing 40G iSCSI vs 16G Fibre Channel is nonsense at all. 

So what we did here is to create a dedicated TCP/IP network with 100G ethernet switches and a 32G Fibre Channel SAN network. And we started to test respectively 40G ethernet vs 32G FC then 100G ethernet vs 64G FC. We chose this because they are dominant current average connectivities at the market, and can be compared as apples to apples both in terms of price and performance.  

First of all, let's look at the economics;


iscsivsfceconomics

* Costs are calculated from the online list prices of these components.


While the most important thing is availability we should create our storage infrastructure redundantly. So we need at least 2 components from each to find the minimal cost per server to create redundant storage fabric. Below table shows costs per connectivity type only for a single server. However, you can calculate your own costs depending on your numbers easily.


iscsivsfceconomics

Expense ratios of the storage networks


According to cost tables, creating an FC SAN storage network is ~67% more expensive than an iSCSI network. But before deciding on your future infrastructure, we need performance numbers.

Test Environment Details

To avoid any storage bottlenecks we used the NGX Storage NS200 SCM system.  

Storage: NGX Storage NS200 SCM all-flash

  • 2TB DRAM
  • 24 Intel® Optane™ SSD DC P5800X 400GB
  • 4 x 32G Fibre Channel
  • 4 x 100GbE QSFP

Server : Dell R740 / OS Ubuntu 20.04 

  • 256GB Memory
  • Intel(R) Xeon(R) Gold 6142M CPU @ 2.60GHz
  • 2 x 32G Fibre Channel
  • 1 x 40G (Mellanox Connect-X 4)
  • 1 x 100G (Mellanox Connect-X 5)


iscsivsfctestbed
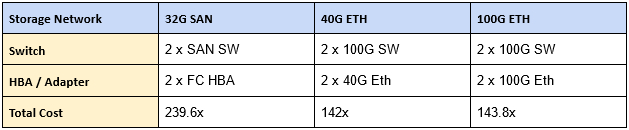
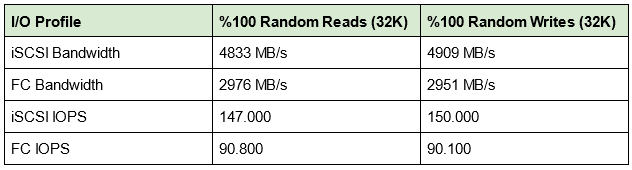
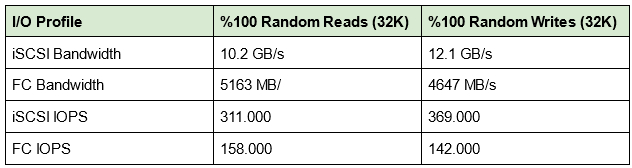
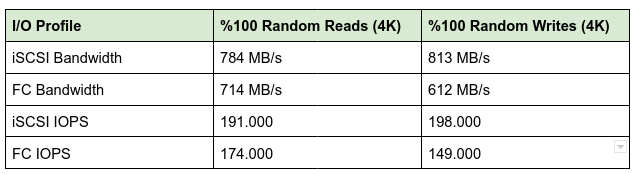
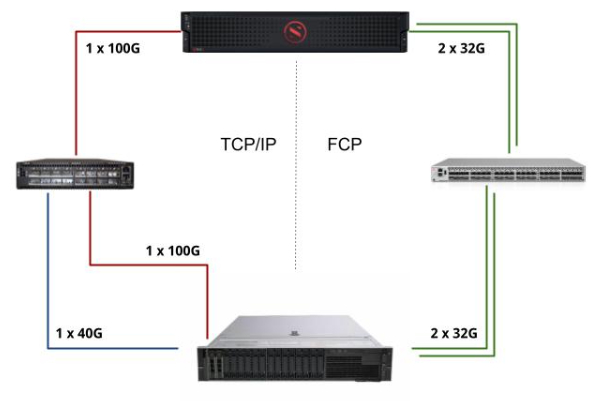
iSCSI vs FibreChannel Testbed


We created 8 logical units for test setup and exported them for both FC and iSCSI targets. These tests were conducted via  fio and vdbench which are industry standard benchmark tools. While both results are similar we are sharing fio results here to keep it short. Additionally, we chose an average block size 32k to generate enough throughput and IOPS that can stress this setup. Last but not least we used jumbo frames (MTU 9000) at the network config.


32g_fc_vs_40g_eth

32G FC vs 40G iSCSI


64g_fc_vs_100g_eth

64G FC vs 100G iSCSI


As we see from these test results iSCSI is as fast as expected. Because network adapters have more bandwidth. So we can say it's not an apple to apple comparison.  However, if we look from a price/performance perspective it definitely is. To clarify the whole picture, let's look below test results which are made with 4K block sizes without saturating the adapter bandwidths. This way we can compare FC vs iSCSI performances as a storage network and the protocols only.


32g_fc_vs_40g_eth_4k

32G FC vs 40G iSCSI (4k block)


Conclusion

Contrary to popular belief, iSCSI is not slow at all. Actually, it is one of the fastest block storage network today. While NGX Storage supports both FC and iSCSI in its products we can’t take sides between them. Therefore our customers should read and acknowledge this blog post as a technical highlight that helps understanding storage network performance numbers.


Notes: 

Networking

You should create a proper storage network while stability,  performance, and reliability are the main subjects. So, just like the SAN network, we need low latency, non-blocking, and lossless packet switching capabilities from the switch network. 

TCP Offload Engine     

Some vendors are providing iSCSI offload with their ToE supported cards. With iSCSI offload, your systems will benefit from low latency, higher IOPS, and lower processor utilization. 

NVMeOF

NVMe is a vital point when we consider future-ready storage fabrics. As a note, both Ethernet and FibreChannel support NVMe over Fabric on top of their network.


Reference:

  • https://en.wikipedia.org/wiki/Fibre_Channel
  • https://en.wikipedia.org/wiki/ISCSI
  • https://en.wikipedia.org/wiki/Jumbo_frame
  • https://en.wikipedia.org/wiki/TCP_offload_engine
  • https://fio.readthedocs.io/en/latest/
  • https://www.oracle.com/downloads/server-storage/vdbench-downloads.html

Fio Results:

# FC 32G randomwrite / 32K Block size

fio --rw=randwrite --ioengine=libaio --name=random --size=20g --direct=1 --invalidate=1 --fsync_on_close=1 --norandommap --group_reporting --exitall --runtime=60 --time_based --iodepth=32 --numjobs=24 --bs=32k --filename=/dev/sda:/dev/sdc:/dev/sdd:/dev/sde:/dev/sdf:/dev/sdg:/dev/sdh:/dev/sdi
random: (g=0): rw=randwrite, bs=(R) 32.0KiB-32.0KiB, (W) 32.0KiB-32.0KiB, (T) 32.0KiB-32.0KiB, ioengine=libaio, iodepth=32
...
fio-3.16
Starting 24 processes
Jobs: 24 (f=192): [w(24)][100.0%][w=2899MiB/s][w=92.8k IOPS][eta 00m:00s]
random: (groupid=0, jobs=24): err= 0: pid=13243: Mon Aug 9 14:18:09 2021
write: IOPS=90.1k, BW=2815MiB/s (2951MB/s)(165GiB/60010msec); 0 zone resets
slat (usec): min=3, max=52314, avg=29.97, stdev=97.15
clat (nsec): min=1919, max=279448k, avg=8493051.20, stdev=19921490.32
lat (usec): min=97, max=279488, avg=8523.44, stdev=19921.32
clat percentiles (usec):
| 1.00th=[ 297], 5.00th=[ 709], 10.00th=[ 1020], 20.00th=[ 1450],
| 30.00th=[ 1827], 40.00th=[ 2212], 50.00th=[ 2671], 60.00th=[ 3228],
| 70.00th=[ 4080], 80.00th=[ 5932], 90.00th=[ 14484], 95.00th=[ 49021],
| 99.00th=[108528], 99.50th=[127402], 99.90th=[164627], 99.95th=[179307],
| 99.99th=[212861]
bw ( MiB/s): min= 1872, max= 4049, per=99.99%, avg=2814.28, stdev=15.86, samples=2880
iops : min=59926, max=129579, avg=90056.14, stdev=507.64, samples=2880
lat (usec) : 2=0.01%, 4=0.01%, 10=0.01%, 50=0.01%, 100=0.01%
lat (usec) : 250=0.71%, 500=1.86%, 750=2.93%, 1000=4.11%
lat (msec) : 2=24.79%, 4=34.73%, 10=18.14%, 20=4.24%, 50=3.59%
lat (msec) : 100=3.58%, 250=1.31%, 500=0.01%
cpu : usr=3.47%, sys=11.15%, ctx=4692047, majf=0, minf=11550
IO depths : 1=0.1%, 2=0.1%, 4=0.1%, 8=0.1%, 16=0.1%, 32=100.0%, >=64=0.0%
submit : 0=0.0%, 4=100.0%, 8=0.0%, 16=0.0%, 32=0.0%, 64=0.0%, >=64=0.0%
complete : 0=0.0%, 4=100.0%, 8=0.0%, 16=0.0%, 32=0.1%, 64=0.0%, >=64=0.0%
issued rwts: total=0,5405019,0,0 short=0,0,0,0 dropped=0,0,0,0
latency : target=0, window=0, percentile=100.00%, depth=32

Run status group 0 (all jobs):
WRITE: bw=2815MiB/s (2951MB/s), 2815MiB/s-2815MiB/s (2951MB/s-2951MB/s), io=165GiB (177GB), run=60010-60010msec

Disk stats (read/write):
sda: ios=76/672359, merge=0/61, ticks=2971/29410698, in_queue=28056724, util=99.80%
sdc: ios=80/675652, merge=0/2, ticks=85/1729028, in_queue=456664, util=99.82%
sdd: ios=89/675650, merge=0/1, ticks=165/1754645, in_queue=476600, util=99.83%
sde: ios=107/675640, merge=0/2, ticks=163/1736901, in_queue=458316, util=99.87%
sdf: ios=136/675628, merge=0/2, ticks=229/1675202, in_queue=414552, util=99.89%
sdg: ios=143/675626, merge=0/1, ticks=376/1683470, in_queue=415936, util=99.91%
sdh: ios=179/675623, merge=0/0, ticks=224/1720457, in_queue=453484, util=99.94%
sdi: ios=166/675609, merge=0/6, ticks=2374/5740380, in_queue=4325732, util=99.94%

# FC 32G randomread / 32K Block size

fio --rw=randread --ioengine=libaio --name=random --size=20g --direct=1 --invalidate=1 --fsync_on_close=1 --norandommap --group_reporting --exitall --runtime=60 --time_based --iodepth=32 --numjobs=24 --bs=32k --filename=/dev/sda:/dev/sdc:/dev/sdd:/dev/sde:/dev/sdf:/dev/sdg:/dev/sdh:/dev/sdi
random: (g=0): rw=randread, bs=(R) 32.0KiB-32.0KiB, (W) 32.0KiB-32.0KiB, (T) 32.0KiB-32.0KiB, ioengine=libaio, iodepth=32
...
fio-3.16
Starting 24 processes
Jobs: 24 (f=192): [r(24)][100.0%][r=2762MiB/s][r=88.4k IOPS][eta 00m:00s]
random: (groupid=0, jobs=24): err= 0: pid=19896: Mon Aug 9 14:20:45 2021
read: IOPS=90.8k, BW=2838MiB/s (2976MB/s)(166GiB/60008msec)
slat (usec): min=3, max=647, avg=15.07, stdev=11.60
clat (usec): min=70, max=215045, avg=8437.26, stdev=11719.66
lat (usec): min=92, max=215057, avg=8452.73, stdev=11719.49
clat percentiles (usec):
| 1.00th=[ 1254], 5.00th=[ 1663], 10.00th=[ 1991], 20.00th=[ 2573],
| 30.00th=[ 3064], 40.00th=[ 3589], 50.00th=[ 4293], 60.00th=[ 5538],
| 70.00th=[ 7439], 80.00th=[ 10814], 90.00th=[ 18482], 95.00th=[ 29492],
| 99.00th=[ 61604], 99.50th=[ 76022], 99.90th=[109577], 99.95th=[125305],
| 99.99th=[162530]
bw ( MiB/s): min= 2042, max= 4014, per=99.99%, avg=2837.96, stdev=17.21, samples=2880
iops : min=65350, max=128472, avg=90814.26, stdev=550.78, samples=2880
lat (usec) : 100=0.01%, 250=0.01%, 500=0.01%, 750=0.04%, 1000=0.19%
lat (msec) : 2=9.90%, 4=36.44%, 10=31.46%, 20=12.95%, 50=7.27%
lat (msec) : 100=1.59%, 250=0.15%
cpu : usr=2.56%, sys=7.10%, ctx=5232143, majf=0, minf=15325
IO depths : 1=0.1%, 2=0.1%, 4=0.1%, 8=0.1%, 16=0.1%, 32=100.0%, >=64=0.0%
submit : 0=0.0%, 4=100.0%, 8=0.0%, 16=0.0%, 32=0.0%, 64=0.0%, >=64=0.0%
complete : 0=0.0%, 4=100.0%, 8=0.0%, 16=0.0%, 32=0.1%, 64=0.0%, >=64=0.0%
issued rwts: total=5450191,0,0,0 short=0,0,0,0 dropped=0,0,0,0
latency : target=0, window=0, percentile=100.00%, depth=32

Run status group 0 (all jobs):
READ: bw=2838MiB/s (2976MB/s), 2838MiB/s-2838MiB/s (2976MB/s-2976MB/s), io=166GiB (179GB), run=60008-60008msec

Disk stats (read/write):
sda: ios=678997/0, merge=11/0, ticks=7050720/0, in_queue=5582820, util=99.62%
sdc: ios=679011/0, merge=17/0, ticks=7807170/0, in_queue=6350700, util=99.66%
sdd: ios=679034/0, merge=13/0, ticks=6416492/0, in_queue=4946616, util=99.68%
sde: ios=678979/0, merge=7/0, ticks=6162488/0, in_queue=4684856, util=99.88%
sdf: ios=679047/0, merge=8/0, ticks=5285084/0, in_queue=3805036, util=99.72%
sdg: ios=679055/0, merge=9/0, ticks=5711760/0, in_queue=4237272, util=99.76%
sdh: ios=678769/0, merge=11/0, ticks=5581873/0, in_queue=4098172, util=99.78%
sdi: ios=679061/0, merge=2/0, ticks=1766793/0, in_queue=205180, util=99.79%

# ISCSI 100G randomwrite / 32K Block size

fio --rw=randwrite --ioengine=libaio --name=random --size=20g --direct=1 --invalidate=1 --fsync_on_close=1 --norandommap --group_reporting --exitall --runtime=60 --time_based --iodepth=32 --numjobs=24 --bs=32k --filename=/dev/sda:/dev/sdb:/dev/sdc:/dev/sdd:/dev/sde:/dev/sdf:/dev/sdg:/dev/sdh
random: (g=0): rw=randwrite, bs=(R) 32.0KiB-32.0KiB, (W) 32.0KiB-32.0KiB, (T) 32.0KiB-32.0KiB, ioengine=libaio, iodepth=32
...
fio-3.16
Starting 24 processes
Jobs: 24 (f=192): [w(24)][100.0%][w=11.5GiB/s][w=376k IOPS][eta 00m:00s]
random: (groupid=0, jobs=24): err= 0: pid=26320: Mon Aug 9 14:28:52 2021
write: IOPS=369k, BW=11.3GiB/s (12.1GB/s)(675GiB/60004msec); 0 zone resets
slat (usec): min=2, max=22826, avg=37.43, stdev=201.56
clat (usec): min=12, max=158530, avg=2044.13, stdev=2397.96
lat (usec): min=55, max=158551, avg=2081.68, stdev=2450.77
clat percentiles (usec):
| 1.00th=[ 202], 5.00th=[ 277], 10.00th=[ 330], 20.00th=[ 457],
| 30.00th=[ 660], 40.00th=[ 889], 50.00th=[ 1205], 60.00th=[ 1598],
| 70.00th=[ 2147], 80.00th=[ 3064], 90.00th=[ 5014], 95.00th=[ 7111],
| 99.00th=[10159], 99.50th=[11600], 99.90th=[20579], 99.95th=[26084],
| 99.99th=[39584]
bw ( MiB/s): min= 3718, max=12540, per=99.99%, avg=11523.50, stdev=44.09, samples=2880
iops : min=119006, max=401282, avg=368751.24, stdev=1410.96, samples=2880
lat (usec) : 20=0.01%, 50=0.01%, 100=0.04%, 250=3.14%, 500=19.57%
lat (usec) : 750=11.42%, 1000=9.69%
lat (msec) : 2=23.88%, 4=18.27%, 10=12.88%, 20=1.00%, 50=0.10%
lat (msec) : 100=0.01%, 250=0.01%
cpu : usr=5.62%, sys=19.98%, ctx=11399948, majf=0, minf=20652
IO depths : 1=0.1%, 2=0.1%, 4=0.1%, 8=0.1%, 16=0.1%, 32=100.0%, >=64=0.0%
submit : 0=0.0%, 4=100.0%, 8=0.0%, 16=0.0%, 32=0.0%, 64=0.0%, >=64=0.0%
complete : 0=0.0%, 4=100.0%, 8=0.0%, 16=0.0%, 32=0.1%, 64=0.0%, >=64=0.0%
issued rwts: total=0,22128185,0,0 short=0,0,0,0 dropped=0,0,0,0
latency : target=0, window=0, percentile=100.00%, depth=32

Run status group 0 (all jobs):
WRITE: bw=11.3GiB/s (12.1GB/s), 11.3GiB/s-11.3GiB/s (12.1GB/s-12.1GB/s), io=675GiB (725GB), run=60004-60004msec

Disk stats (read/write):
sda: ios=99/2752163, merge=0/3140, ticks=51/4412371, in_queue=1425048, util=99.78%
sdb: ios=67/2750438, merge=0/4785, ticks=54/6071205, in_queue=2471248, util=99.84%
sdc: ios=73/2752430, merge=0/2897, ticks=52/4168589, in_queue=1410376, util=99.88%
sdd: ios=77/2752193, merge=0/3022, ticks=60/4352598, in_queue=1209072, util=99.87%
sde: ios=81/2752607, merge=0/2683, ticks=46/3783654, in_queue=1259132, util=99.92%
sdf: ios=85/2750446, merge=0/4806, ticks=70/5880030, in_queue=2479196, util=99.91%
sdg: ios=96/2752439, merge=0/2640, ticks=55/3764635, in_queue=1259592, util=99.93%
sdh: ios=99/2752171, merge=0/2907, ticks=58/3943191, in_queue=1467624, util=99.98%

# ISCSI 100G randomread / 32K Block size

fio --rw=randread --ioengine=libaio --name=random --size=20g --direct=1 --invalidate=1 --fsync_on_close=1 --norandommap --group_reporting --exitall --runtime=60 --time_based --iodepth=32 --numjobs=24 --bs=32k --filename=/dev/sda:/dev/sdb:/dev/sdc:/dev/sdd:/dev/sde:/dev/sdf:/dev/sdg:/dev/sdh
random: (g=0): rw=randread, bs=(R) 32.0KiB-32.0KiB, (W) 32.0KiB-32.0KiB, (T) 32.0KiB-32.0KiB, ioengine=libaio, iodepth=32
...
fio-3.16
Starting 24 processes
Jobs: 24 (f=192): [r(24)][100.0%][r=9.77GiB/s][r=320k IOPS][eta 00m:00s]
random: (groupid=0, jobs=24): err= 0: pid=28942: Mon Aug 9 14:31:01 2021
read: IOPS=311k, BW=9728MiB/s (10.2GB/s)(570GiB/60008msec)
slat (usec): min=2, max=15998, avg=54.88, stdev=311.12
clat (nsec): min=1346, max=117426k, avg=2411243.14, stdev=2988906.27
lat (usec): min=49, max=117431, avg=2466.22, stdev=3088.44
clat percentiles (usec):
| 1.00th=[ 133], 5.00th=[ 227], 10.00th=[ 285], 20.00th=[ 383],
| 30.00th=[ 529], 40.00th=[ 898], 50.00th=[ 1369], 60.00th=[ 1860],
| 70.00th=[ 2573], 80.00th=[ 3720], 90.00th=[ 6194], 95.00th=[ 8848],
| 99.00th=[13042], 99.50th=[14615], 99.90th=[21890], 99.95th=[28705],
| 99.99th=[44303]
bw ( MiB/s): min= 8219, max=11179, per=99.99%, avg=9727.58, stdev=22.70, samples=2880
iops : min=263008, max=357737, avg=311281.48, stdev=726.34, samples=2880
lat (usec) : 2=0.01%, 10=0.01%, 20=0.01%, 50=0.01%, 100=0.39%
lat (usec) : 250=6.44%, 500=21.95%, 750=8.05%, 1000=5.38%
lat (msec) : 2=20.31%, 4=19.10%, 10=14.88%, 20=3.39%, 50=0.12%
lat (msec) : 100=0.01%, 250=0.01%
cpu : usr=2.24%, sys=13.14%, ctx=7622754, majf=0, minf=28545
IO depths : 1=0.1%, 2=0.1%, 4=0.1%, 8=0.1%, 16=0.1%, 32=100.0%, >=64=0.0%
submit : 0=0.0%, 4=100.0%, 8=0.0%, 16=0.0%, 32=0.0%, 64=0.0%, >=64=0.0%
complete : 0=0.0%, 4=100.0%, 8=0.0%, 16=0.0%, 32=0.1%, 64=0.0%, >=64=0.0%
issued rwts: total=18680735,0,0,0 short=0,0,0,0 dropped=0,0,0,0
latency : target=0, window=0, percentile=100.00%, depth=32

Run status group 0 (all jobs):
READ: bw=9728MiB/s (10.2GB/s), 9728MiB/s-9728MiB/s (10.2GB/s-10.2GB/s), io=570GiB (612GB), run=60008-60008msec

Disk stats (read/write):
sda: ios=2325147/0, merge=2153/0, ticks=3577557/0, in_queue=1550356, util=99.81%
sdb: ios=2322967/0, merge=4363/0, ticks=5969166/0, in_queue=3269420, util=99.81%
sdc: ios=2325538/0, merge=1766/0, ticks=3107834/0, in_queue=1333404, util=99.84%
sdd: ios=2324621/0, merge=2602/0, ticks=4137631/0, in_queue=1904632, util=99.84%
sde: ios=2325548/0, merge=1832/0, ticks=3090372/0, in_queue=1324000, util=99.88%
sdf: ios=2323925/0, merge=3299/0, ticks=4792066/0, in_queue=2390652, util=99.88%
sdg: ios=2326375/0, merge=1038/0, ticks=2125565/0, in_queue=680320, util=99.91%
sdh: ios=2325828/0, merge=1374/0, ticks=2568624/0, in_queue=1053704, util=99.94%

# FC 64G randomwrite / 32K Block size

fio --rw=randwrite --ioengine=libaio --name=random --size=20g --direct=1 --invalidate=1 --fsync_on_close=1 --norandommap --group_reporting --exitall --runtime=60 --time_based --iodepth=32 --numjobs=24 --bs=32k --filename=/dev/sdf:/dev/sdg:/dev/sdh:/dev/sdi:/dev/sdb:/dev/sdc:/dev/sdd:/dev/sde
random: (g=0): rw=randwrite, bs=(R) 32.0KiB-32.0KiB, (W) 32.0KiB-32.0KiB, (T) 32.0KiB-32.0KiB, ioengine=libaio, iodepth=32
...
fio-3.16
Starting 24 processes
Jobs: 24 (f=192): [w(24)][100.0%][w=4409MiB/s][w=141k IOPS][eta 00m:00s]
random: (groupid=0, jobs=24): err= 0: pid=17176: Tue Aug 10 09:27:20 2021
write: IOPS=142k, BW=4432MiB/s (4647MB/s)(260GiB/60007msec); 0 zone resets
slat (usec): min=3, max=8465, avg=26.29, stdev=63.42
clat (nsec): min=1377, max=221987k, avg=5386099.00, stdev=10797360.99
lat (usec): min=87, max=222000, avg=5412.75, stdev=10797.10
clat percentiles (usec):
| 1.00th=[ 110], 5.00th=[ 155], 10.00th=[ 221], 20.00th=[ 404],
| 30.00th=[ 676], 40.00th=[ 1037], 50.00th=[ 1516], 60.00th=[ 2245],
| 70.00th=[ 3523], 80.00th=[ 6259], 90.00th=[ 14615], 95.00th=[ 26084],
| 99.00th=[ 55313], 99.50th=[ 67634], 99.90th=[ 93848], 99.95th=[105382],
| 99.99th=[130548]
bw ( MiB/s): min= 2872, max= 7320, per=99.99%, avg=4431.28, stdev=29.57, samples=2880
iops : min=91922, max=234254, avg=141800.09, stdev=946.25, samples=2880
lat (usec) : 2=0.01%, 4=0.01%, 10=0.01%, 20=0.01%, 50=0.01%
lat (usec) : 100=0.31%, 250=11.58%, 500=11.97%, 750=8.44%, 1000=6.83%
lat (msec) : 2=18.01%, 4=15.35%, 10=13.54%, 20=6.83%, 50=5.78%
lat (msec) : 100=1.28%, 250=0.07%
cpu : usr=5.00%, sys=15.40%, ctx=7565473, majf=0, minf=10271
IO depths : 1=0.1%, 2=0.1%, 4=0.1%, 8=0.1%, 16=0.1%, 32=100.0%, >=64=0.0%
submit : 0=0.0%, 4=100.0%, 8=0.0%, 16=0.0%, 32=0.0%, 64=0.0%, >=64=0.0%
complete : 0=0.0%, 4=100.0%, 8=0.0%, 16=0.0%, 32=0.1%, 64=0.0%, >=64=0.0%
issued rwts: total=0,8509825,0,0 short=0,0,0,0 dropped=0,0,0,0
latency : target=0, window=0, percentile=100.00%, depth=32

Run status group 0 (all jobs):
WRITE: bw=4432MiB/s (4647MB/s), 4432MiB/s-4432MiB/s (4647MB/s-4647MB/s), io=260GiB (279GB), run=60007-60007msec

Disk stats (read/write):
sdf: ios=77/1063700, merge=0/0, ticks=26/850388, in_queue=57456, util=99.72%
sdg: ios=87/1063711, merge=0/2, ticks=24/858639, in_queue=58676, util=99.77%
sdh: ios=103/1063485, merge=0/23, ticks=377/5969271, in_queue=4023072, util=99.82%
sdi: ios=139/1063555, merge=0/20, ticks=432/7080818, in_queue=5089340, util=99.85%
sdb: ios=158/1063407, merge=0/50, ticks=1337/12471721, in_queue=10439728, util=99.86%
sdc: ios=174/1063586, merge=0/44, ticks=1267/16249379, in_queue=14175540, util=99.90%
sdd: ios=191/1063701, merge=0/2, ticks=77/1015834, in_queue=94512, util=99.93%
sde: ios=190/1063661, merge=0/2, ticks=121/1105839, in_queue=115992, util=99.96%

# FC 64G randomread / 32K Block size

fio --rw=randread --ioengine=libaio --name=random --size=20g --direct=1 --invalidate=1 --fsync_on_close=1 --norandommap --group_reporting --exitall --runtime=60 --time_based --iodepth=32 --numjobs=24 --bs=32k --filename=/dev/sdf:/dev/sdg:/dev/sdh:/dev/sdi:/dev/sdb:/dev/sdc:/dev/sdd:/dev/sde
random: (g=0): rw=randread, bs=(R) 32.0KiB-32.0KiB, (W) 32.0KiB-32.0KiB, (T) 32.0KiB-32.0KiB, ioengine=libaio, iodepth=32
...
fio-3.16
Starting 24 processes
Jobs: 24 (f=192): [r(24)][100.0%][r=4922MiB/s][r=157k IOPS][eta 00m:00s]
random: (groupid=0, jobs=24): err= 0: pid=23220: Tue Aug 10 09:29:30 2021
read: IOPS=158k, BW=4924MiB/s (5163MB/s)(289GiB/60010msec)
slat (usec): min=4, max=497, avg=15.23, stdev=11.49
clat (usec): min=2, max=134519, avg=4856.01, stdev=8220.20
lat (usec): min=80, max=134534, avg=4871.60, stdev=8219.90
clat percentiles (usec):
| 1.00th=[ 302], 5.00th=[ 594], 10.00th=[ 775], 20.00th=[ 1057],
| 30.00th=[ 1336], 40.00th=[ 1647], 50.00th=[ 2024], 60.00th=[ 2638],
| 70.00th=[ 3687], 80.00th=[ 5800], 90.00th=[ 11469], 95.00th=[ 19530],
| 99.00th=[ 43254], 99.50th=[ 54264], 99.90th=[ 77071], 99.95th=[ 85459],
| 99.99th=[100140]
bw ( MiB/s): min= 3748, max= 6488, per=100.00%, avg=4923.52, stdev=28.18, samples=2880
iops : min=119944, max=207631, avg=157552.06, stdev=901.61, samples=2880
lat (usec) : 4=0.01%, 20=0.01%, 50=0.01%, 100=0.06%, 250=0.61%
lat (usec) : 500=2.55%, 750=5.95%, 1000=8.69%
lat (msec) : 2=31.66%, 4=22.61%, 10=16.19%, 20=6.81%, 50=4.20%
lat (msec) : 100=0.65%, 250=0.01%
cpu : usr=4.13%, sys=11.76%, ctx=8748698, majf=0, minf=15238
IO depths : 1=0.1%, 2=0.1%, 4=0.1%, 8=0.1%, 16=0.1%, 32=100.0%, >=64=0.0%
submit : 0=0.0%, 4=100.0%, 8=0.0%, 16=0.0%, 32=0.0%, 64=0.0%, >=64=0.0%
complete : 0=0.0%, 4=100.0%, 8=0.0%, 16=0.0%, 32=0.1%, 64=0.0%, >=64=0.0%
issued rwts: total=9454880,0,0,0 short=0,0,0,0 dropped=0,0,0,0
latency : target=0, window=0, percentile=100.00%, depth=32

Run status group 0 (all jobs):
READ: bw=4924MiB/s (5163MB/s), 4924MiB/s-4924MiB/s (5163MB/s-5163MB/s), io=289GiB (310GB), run=60010-60010msec

Disk stats (read/write):
sdf: ios=1177865/0, merge=14/0, ticks=3958728/0, in_queue=2039648, util=99.73%
sdg: ios=1177859/0, merge=18/0, ticks=4488655/0, in_queue=2475428, util=99.76%
sdh: ios=1177840/0, merge=21/0, ticks=5190973/0, in_queue=3152964, util=99.81%
sdi: ios=1177860/0, merge=18/0, ticks=5451968/0, in_queue=3471140, util=99.85%
sdb: ios=1177591/0, merge=31/0, ticks=9595141/0, in_queue=7367924, util=99.86%
sdc: ios=1177707/0, merge=16/0, ticks=5389808/0, in_queue=3209780, util=99.90%
sdd: ios=1177868/0, merge=1/0, ticks=1444543/0, in_queue=15944, util=99.91%
sde: ios=1177642/0, merge=28/0, ticks=10157679/0, in_queue=7924056, util=99.93%

# ISCSI 40G randomwrite / 32K Block size

fio --rw=randwrite --ioengine=libaio --name=random --size=20g --direct=1 --invalidate=1 --fsync_on_close=1 --norandommap --group_reporting --exitall --runtime=60 --time_based --iodepth=32 --numjobs=8 --bs=32k --filename=/dev/sdi:/dev/sdb:/dev/sdc:/dev/sdd:/dev/sde:/dev/sdf:/dev/sdg:/dev/sdh
random: (g=0): rw=randwrite, bs=(R) 32.0KiB-32.0KiB, (W) 32.0KiB-32.0KiB, (T) 32.0KiB-32.0KiB, ioengine=libaio, iodepth=32
...
fio-3.16
Starting 8 processes
Jobs: 8 (f=64): [w(8)][100.0%][w=4684MiB/s][w=150k IOPS][eta 00m:00s]
random: (groupid=0, jobs=8): err= 0: pid=36087: Tue Aug 24 16:11:06 2021
write: IOPS=150k, BW=4682MiB/s (4909MB/s)(274GiB/60003msec); 0 zone resets
slat (usec): min=2, max=1007, avg=22.79, stdev=11.97
clat (usec): min=51, max=83870, avg=1684.37, stdev=2338.39
lat (usec): min=87, max=83886, avg=1707.43, stdev=2337.62
clat percentiles (usec):
| 1.00th=[ 225], 5.00th=[ 306], 10.00th=[ 359], 20.00th=[ 433],
| 30.00th=[ 506], 40.00th=[ 603], 50.00th=[ 758], 60.00th=[ 1012],
| 70.00th=[ 1516], 80.00th=[ 2343], 90.00th=[ 4146], 95.00th=[ 6325],
| 99.00th=[11469], 99.50th=[13304], 99.90th=[18482], 99.95th=[23462],
| 99.99th=[38011]
bw ( MiB/s): min= 4549, max= 4796, per=99.98%, avg=4681.12, stdev= 5.73, samples=960
iops : min=145581, max=153500, avg=149795.53, stdev=183.24, samples=960
lat (usec) : 100=0.01%, 250=1.84%, 500=27.41%, 750=20.45%, 1000=9.98%
lat (msec) : 2=16.59%, 4=13.20%, 10=8.91%, 20=1.54%, 50=0.08%
lat (msec) : 100=0.01%
cpu : usr=7.36%, sys=44.99%, ctx=4371222, majf=0, minf=3772
IO depths : 1=0.1%, 2=0.1%, 4=0.1%, 8=0.1%, 16=0.1%, 32=100.0%, >=64=0.0%
submit : 0=0.0%, 4=100.0%, 8=0.0%, 16=0.0%, 32=0.0%, 64=0.0%, >=64=0.0%
complete : 0=0.0%, 4=100.0%, 8=0.0%, 16=0.0%, 32=0.1%, 64=0.0%, >=64=0.0%
issued rwts: total=0,8989672,0,0 short=0,0,0,0 dropped=0,0,0,0
latency : target=0, window=0, percentile=100.00%, depth=32

Run status group 0 (all jobs):
WRITE: bw=4682MiB/s (4909MB/s), 4682MiB/s-4682MiB/s (4909MB/s-4909MB/s), io=274GiB (295GB), run=60003-60003msec

Disk stats (read/write):
sdi: ios=102/1120444, merge=0/402, ticks=110/1948704, in_queue=738576, util=99.87%
sdb: ios=108/1120264, merge=0/578, ticks=94/2457704, in_queue=1066512, util=99.89%
sdc: ios=69/1120464, merge=0/390, ticks=55/1932764, in_queue=700948, util=99.90%
sdd: ios=70/1120503, merge=0/351, ticks=56/1817100, in_queue=627440, util=99.90%
sde: ios=69/1120323, merge=0/399, ticks=62/1978459, in_queue=706900, util=99.92%
sdf: ios=67/1120618, merge=0/209, ticks=39/1486035, in_queue=369348, util=99.92%
sdg: ios=70/1120681, merge=0/160, ticks=40/1280505, in_queue=244416, util=99.95%
sdh: ios=68/1120398, merge=0/452, ticks=39/2032347, in_queue=790108, util=99.95%

# ISCSI 40G randomread / 32K Block size

fio --rw=randread --ioengine=libaio --name=random --size=20g --direct=1 --invalidate=1 --fsync_on_close=1 --norandommap --group_reporting --exitall --runtime=60 --time_based --iodepth=32 --numjobs=8 --bs=32k --filename=/dev/sdi:/dev/sdb:/dev/sdc:/dev/sdd:/dev/sde:/dev/sdf:/dev/sdg:/dev/sdh
random: (g=0): rw=randread, bs=(R) 32.0KiB-32.0KiB, (W) 32.0KiB-32.0KiB, (T) 32.0KiB-32.0KiB, ioengine=libaio, iodepth=32
...
fio-3.16
Starting 8 processes
Jobs: 8 (f=64): [r(8)][100.0%][r=4612MiB/s][r=148k IOPS][eta 00m:00s]
random: (groupid=0, jobs=8): err= 0: pid=37475: Tue Aug 24 16:13:02 2021
read: IOPS=147k, BW=4609MiB/s (4833MB/s)(270GiB/60005msec)
slat (nsec): min=1945, max=97891k, avg=16815.93, stdev=60543.38
clat (nsec): min=444, max=132128k, avg=1717382.04, stdev=2532988.67
lat (usec): min=78, max=132134, avg=1734.46, stdev=2533.63
clat percentiles (usec):
| 1.00th=[ 139], 5.00th=[ 192], 10.00th=[ 237], 20.00th=[ 326],
| 30.00th=[ 441], 40.00th=[ 594], 50.00th=[ 824], 60.00th=[ 1205],
| 70.00th=[ 1696], 80.00th=[ 2311], 90.00th=[ 4146], 95.00th=[ 6652],
| 99.00th=[11994], 99.50th=[13829], 99.90th=[19268], 99.95th=[25560],
| 99.99th=[44827]
bw ( MiB/s): min= 3921, max= 4780, per=99.99%, avg=4608.40, stdev=13.53, samples=960
iops : min=125500, max=152978, avg=147468.49, stdev=432.91, samples=960
lat (nsec) : 500=0.01%, 750=0.01%, 1000=0.01%
lat (usec) : 2=0.01%, 4=0.01%, 10=0.01%, 20=0.01%, 50=0.01%
lat (usec) : 100=0.06%, 250=11.47%, 500=22.88%, 750=13.00%, 1000=7.77%
lat (msec) : 2=20.72%, 4=13.69%, 10=8.48%, 20=1.84%, 50=0.08%
lat (msec) : 100=0.01%, 250=0.01%
cpu : usr=4.34%, sys=35.50%, ctx=4847513, majf=0, minf=4641
IO depths : 1=0.1%, 2=0.1%, 4=0.1%, 8=0.1%, 16=0.1%, 32=100.0%, >=64=0.0%
submit : 0=0.0%, 4=100.0%, 8=0.0%, 16=0.0%, 32=0.0%, 64=0.0%, >=64=0.0%
complete : 0=0.0%, 4=100.0%, 8=0.0%, 16=0.0%, 32=0.1%, 64=0.0%, >=64=0.0%
issued rwts: total=8849635,0,0,0 short=0,0,0,0 dropped=0,0,0,0
latency : target=0, window=0, percentile=100.00%, depth=32

Run status group 0 (all jobs):
READ: bw=4609MiB/s (4833MB/s), 4609MiB/s-4609MiB/s (4833MB/s-4833MB/s), io=270GiB (290GB), run=60005-60005msec

Disk stats (read/write):
sdi: ios=1103545/0, merge=43/0, ticks=923489/0, in_queue=40488, util=99.68%
sdb: ios=1103391/0, merge=191/0, ticks=1463725/0, in_queue=318276, util=99.69%
sdc: ios=1103536/0, merge=51/0, ticks=921654/0, in_queue=64784, util=99.70%
sdd: ios=1103493/0, merge=83/0, ticks=1028444/0, in_queue=139716, util=99.86%
sde: ios=1103570/0, merge=14/0, ticks=827315/0, in_queue=1700, util=99.71%
sdf: ios=1102155/0, merge=1265/0, ticks=4257267/0, in_queue=2346016, util=99.72%
sdg: ios=1102327/0, merge=1240/0, ticks=4237243/0, in_queue=2315936, util=99.73%
sdh: ios=1103490/0, merge=96/0, ticks=1157271/0, in_queue=127324, util=99.75%

# ISCSI 40G randomwrite / 4K Block size

fio --rw=randwrite --ioengine=libaio --name=random --size=20g --direct=1 --invalidate=1 --fsync_on_close=1 --norandommap --group_reporting --exitall --runtime=60 --time_based --iodepth=32 --numjobs=24 --bs=4k --filename=/dev/sdb:/dev/sdc:/dev/sdd:/dev/sde:/dev/sdf:/dev/sdg:/dev/sdi
random: (g=0): rw=randwrite, bs=(R) 4096B-4096B, (W) 4096B-4096B, (T) 4096B-4096B, ioengine=libaio, iodepth=32
...
fio-3.16
Starting 24 processes
Jobs: 24 (f=168): [w(24)][100.0%][w=829MiB/s][w=212k IOPS][eta 00m:00s]
random: (groupid=0, jobs=24): err= 0: pid=12665: Mon Sep 6 15:28:41 2021
write: IOPS=198k, BW=775MiB/s (813MB/s)(45.4GiB/60006msec); 0 zone resets
slat (usec): min=2, max=7088, avg=22.03, stdev=61.21
clat (nsec): min=421, max=154679k, avg=3846762.03, stdev=4262129.77
lat (usec): min=53, max=154694, avg=3869.07, stdev=4266.94
clat percentiles (usec):
| 1.00th=[ 155], 5.00th=[ 293], 10.00th=[ 420], 20.00th=[ 635],
| 30.00th=[ 857], 40.00th=[ 1401], 50.00th=[ 2180], 60.00th=[ 3359],
| 70.00th=[ 4883], 80.00th=[ 6915], 90.00th=[ 9765], 95.00th=[11994],
| 99.00th=[16581], 99.50th=[19268], 99.90th=[34866], 99.95th=[44303],
| 99.99th=[64750]
bw ( KiB/s): min=596920, max=957281, per=99.99%, avg=793559.55, stdev=3257.39, samples=2880
iops : min=149230, max=239320, avg=198389.33, stdev=814.35, samples=2880
lat (nsec) : 500=0.01%, 750=0.01%, 1000=0.01%
lat (usec) : 2=0.01%, 4=0.01%, 10=0.01%, 20=0.01%, 50=0.01%
lat (usec) : 100=0.17%, 250=3.40%, 500=10.14%, 750=11.88%, 1000=8.06%
lat (msec) : 2=14.33%, 4=16.60%, 10=26.04%, 20=8.93%, 50=0.40%
lat (msec) : 100=0.03%, 250=0.01%
cpu : usr=2.55%, sys=17.51%, ctx=8624821, majf=0, minf=3543
IO depths : 1=0.1%, 2=0.1%, 4=0.1%, 8=0.1%, 16=0.1%, 32=100.0%, >=64=0.0%
submit : 0=0.0%, 4=100.0%, 8=0.0%, 16=0.0%, 32=0.0%, 64=0.0%, >=64=0.0%
complete : 0=0.0%, 4=100.0%, 8=0.0%, 16=0.0%, 32=0.1%, 64=0.0%, >=64=0.0%
issued rwts: total=0,11905508,0,0 short=0,0,0,0 dropped=0,0,0,0
latency : target=0, window=0, percentile=100.00%, depth=32

Run status group 0 (all jobs):
WRITE: bw=775MiB/s (813MB/s), 775MiB/s-775MiB/s (813MB/s-813MB/s), io=45.4GiB (48.8GB), run=60006-60006msec

# ISCSI 40G randomread / 4K Block size

fio --rw=randread --ioengine=libaio --name=random --size=20g --direct=1 --invalidate=1 --fsync_on_close=1 --norandommap --group_reporting --exitall --runtime=60 --time_based --iodepth=32 --numjobs=24 --bs=4k --filename=/dev/sdb:/dev/sdc:/dev/sdd:/dev/sde:/dev/sdf:/dev/sdg:/dev/sdi
random: (g=0): rw=randread, bs=(R) 4096B-4096B, (W) 4096B-4096B, (T) 4096B-4096B, ioengine=libaio, iodepth=32
...
fio-3.16
Starting 24 processes
Jobs: 24 (f=168): [r(24)][100.0%][r=774MiB/s][r=198k IOPS][eta 00m:00s]
random: (groupid=0, jobs=24): err= 0: pid=15458: Mon Sep 6 15:50:47 2021
read: IOPS=191k, BW=748MiB/s (784MB/s)(43.8GiB/60006msec)
slat (nsec): min=1448, max=7725.9k, avg=13066.78, stdev=88385.75
clat (nsec): min=453, max=133793k, avg=3998356.78, stdev=4780447.02
lat (usec): min=41, max=133799, avg=4011.54, stdev=4788.26
clat percentiles (usec):
| 1.00th=[ 101], 5.00th=[ 163], 10.00th=[ 235], 20.00th=[ 429],
| 30.00th=[ 562], 40.00th=[ 889], 50.00th=[ 1827], 60.00th=[ 3326],
| 70.00th=[ 5342], 80.00th=[ 7898], 90.00th=[11076], 95.00th=[13173],
| 99.00th=[16450], 99.50th=[17957], 99.90th=[39584], 99.95th=[49021],
| 99.99th=[69731]
bw ( KiB/s): min=694107, max=869120, per=99.99%, avg=765602.99, stdev=1348.88, samples=2880
iops : min=173526, max=217280, avg=191400.38, stdev=337.23, samples=2880
lat (nsec) : 500=0.01%, 750=0.01%, 1000=0.01%
lat (usec) : 10=0.01%, 20=0.01%, 50=0.03%, 100=0.93%, 250=9.96%
lat (usec) : 500=14.47%, 750=12.39%, 1000=3.50%
lat (msec) : 2=10.14%, 4=12.15%, 10=23.47%, 20=12.57%, 50=0.33%
lat (msec) : 100=0.05%, 250=0.01%
cpu : usr=1.12%, sys=7.28%, ctx=9892062, majf=0, minf=3094
IO depths : 1=0.1%, 2=0.1%, 4=0.1%, 8=0.1%, 16=0.1%, 32=100.0%, >=64=0.0%
submit : 0=0.0%, 4=100.0%, 8=0.0%, 16=0.0%, 32=0.0%, 64=0.0%, >=64=0.0%
complete : 0=0.0%, 4=100.0%, 8=0.0%, 16=0.0%, 32=0.1%, 64=0.0%, >=64=0.0%
issued rwts: total=11485797,0,0,0 short=0,0,0,0 dropped=0,0,0,0
latency : target=0, window=0, percentile=100.00%, depth=32

Run status group 0 (all jobs):
READ: bw=748MiB/s (784MB/s), 748MiB/s-748MiB/s (784MB/s-784MB/s), io=43.8GiB (47.0GB), run=60006-60006msec

Disk stats (read/write):
sdb: ios=1636185/0, merge=402/0, ticks=7250108/0, in_queue=4069412, util=99.81%
sdc: ios=1635633/0, merge=792/0, ticks=12912668/0, in_queue=9608452, util=99.83%
sdd: ios=1635621/0, merge=780/0, ticks=13037229/0, in_queue=9730660, util=99.83%
sde: ios=1635806/0, merge=595/0, ticks=10056963/0, in_queue=6780712, util=99.85%
sdf: ios=1636581/0, merge=0/0, ticks=733002/0, in_queue=380, util=99.85%
sdg: ios=1636578/0, merge=1/0, ticks=739285/0, in_queue=224, util=99.86%
sdi: ios=1636575/0, merge=1/0, ticks=747859/0, in_queue=2224, util=99.87%

# 32G FC randomwrite / 4k Block size

fio --rw=randwrite --ioengine=libaio --name=random --size=20g --direct=1 --invalidate=1 --fsync_on_close=1 --norandommap --group_reporting --exitall --runtime=60 --time_based --iodepth=32 --numjobs=24 --bs=4k --filename=/dev/sdb:/dev/sdc:/dev/sdd:/dev/sde:/dev/sdf:/dev/sdg:/dev/sdi
random: (g=0): rw=randwrite, bs=(R) 4096B-4096B, (W) 4096B-4096B, (T) 4096B-4096B, ioengine=libaio, iodepth=32
...
fio-3.16
Starting 24 processes
Jobs: 24 (f=168): [w(24)][100.0%][w=571MiB/s][w=146k IOPS][eta 00m:00s]
random: (groupid=0, jobs=24): err= 0: pid=19103: Mon Sep 6 12:39:37 2021
write: IOPS=149k, BW=583MiB/s (612MB/s)(34.2GiB/60011msec); 0 zone resets
slat (nsec): min=1536, max=8444.5k, avg=18333.39, stdev=12948.59
clat (nsec): min=968, max=206384k, avg=5120638.24, stdev=15466276.36
lat (usec): min=64, max=206398, avg=5139.42, stdev=15466.41
clat percentiles (usec):
| 1.00th=[ 83], 5.00th=[ 96], 10.00th=[ 114], 20.00th=[ 172],
| 30.00th=[ 285], 40.00th=[ 486], 50.00th=[ 791], 60.00th=[ 1221],
| 70.00th=[ 1844], 80.00th=[ 2999], 90.00th=[ 8160], 95.00th=[ 30278],
| 99.00th=[ 86508], 99.50th=[105382], 99.90th=[143655], 99.95th=[154141],
| 99.99th=[175113]
bw ( KiB/s): min=465344, max=753730, per=100.00%, avg=597355.98, stdev=2284.86, samples=2880
iops : min=116336, max=188432, avg=149338.43, stdev=571.22, samples=2880
lat (nsec) : 1000=0.01%
lat (usec) : 2=0.01%, 4=0.01%, 10=0.01%, 20=0.01%, 50=0.01%
lat (usec) : 100=6.28%, 250=21.17%, 500=13.12%, 750=8.19%, 1000=6.45%
lat (msec) : 2=16.69%, 4=12.38%, 10=6.63%, 20=2.48%, 50=3.68%
lat (msec) : 100=2.29%, 250=0.62%
cpu : usr=3.48%, sys=13.75%, ctx=8659903, majf=0, minf=2222
IO depths : 1=0.1%, 2=0.1%, 4=0.1%, 8=0.1%, 16=0.1%, 32=100.0%, >=64=0.0%
submit : 0=0.0%, 4=100.0%, 8=0.0%, 16=0.0%, 32=0.0%, 64=0.0%, >=64=0.0%
complete : 0=0.0%, 4=100.0%, 8=0.0%, 16=0.0%, 32=0.1%, 64=0.0%, >=64=0.0%
issued rwts: total=0,8962181,0,0 short=0,0,0,0 dropped=0,0,0,0
latency : target=0, window=0, percentile=100.00%, depth=32

Run status group 0 (all jobs):
WRITE: bw=583MiB/s (612MB/s), 583MiB/s-583MiB/s (612MB/s-612MB/s), io=34.2GiB (36.7GB), run=60011-60011msec

Disk stats (read/write):
sdb: ios=60/1276063, merge=0/10, ticks=229/36668272, in_queue=34103068, util=99.86%
sdc: ios=75/1276708, merge=0/0, ticks=15/410877, in_queue=1128, util=99.91%
sdd: ios=79/1276642, merge=0/1, ticks=179/1678837, in_queue=374496, util=99.93%
sde: ios=96/1276704, merge=0/0, ticks=12/381689, in_queue=1324, util=99.95%
sdf: ios=106/1276699, merge=0/0, ticks=55/1522075, in_queue=281904, util=99.97%
sdg: ios=112/1276685, merge=0/2, ticks=190/3300093, in_queue=1135392, util=99.98%
sdi: ios=134/1276689, merge=0/0, ticks=76/1709044, in_queue=380036, util=99.99%

# 32G FC randomread / 4k Block size

fio --rw=randread --ioengine=libaio --name=random --size=20g --direct=1 --invalidate=1 --fsync_on_close=1 --norandommap --group_reporting --exitall --runtime=60 --time_based --iodepth=32 --numjobs=24 --bs=4k --filename=/dev/sdb:/dev/sdc:/dev/sdd:/dev/sde:/dev/sdf:/dev/sdg:/dev/sdi
random: (g=0): rw=randread, bs=(R) 4096B-4096B, (W) 4096B-4096B, (T) 4096B-4096B, ioengine=libaio, iodepth=32
...
fio-3.16
Starting 24 processes
Jobs: 24 (f=168): [r(24)][100.0%][r=711MiB/s][r=182k IOPS][eta 00m:00s]
random: (groupid=0, jobs=24): err= 0: pid=22947: Mon Sep 6 12:41:45 2021
read: IOPS=174k, BW=681MiB/s (714MB/s)(39.9GiB/60008msec)
slat (usec): min=3, max=866, avg=13.71, stdev=16.95
clat (nsec): min=831, max=350900k, avg=4390257.27, stdev=9790207.13
lat (usec): min=54, max=350908, avg=4404.42, stdev=9790.54
clat percentiles (usec):
| 1.00th=[ 71], 5.00th=[ 103], 10.00th=[ 167], 20.00th=[ 314],
| 30.00th=[ 506], 40.00th=[ 758], 50.00th=[ 1123], 60.00th=[ 1762],
| 70.00th=[ 2933], 80.00th=[ 5211], 90.00th=[ 11076], 95.00th=[ 19792],
| 99.00th=[ 49546], 99.50th=[ 63701], 99.90th=[ 94897], 99.95th=[106431],
| 99.99th=[141558]
bw ( KiB/s): min=323440, max=805868, per=99.99%, avg=696941.88, stdev=2159.13, samples=2880
iops : min=80860, max=201467, avg=174234.88, stdev=539.78, samples=2880
lat (nsec) : 1000=0.01%
lat (usec) : 2=0.01%, 4=0.01%, 10=0.01%, 20=0.01%, 50=0.05%
lat (usec) : 100=4.60%, 250=11.17%, 500=13.87%, 750=10.04%, 1000=7.32%
lat (msec) : 2=15.47%, 4=13.00%, 10=13.32%, 20=6.23%, 50=3.92%
lat (msec) : 100=0.90%, 250=0.07%, 500=0.01%
cpu : usr=3.82%, sys=12.08%, ctx=9466133, majf=0, minf=1922
IO depths : 1=0.1%, 2=0.1%, 4=0.1%, 8=0.1%, 16=0.1%, 32=100.0%, >=64=0.0%
submit : 0=0.0%, 4=100.0%, 8=0.0%, 16=0.0%, 32=0.0%, 64=0.0%, >=64=0.0%
complete : 0=0.0%, 4=100.0%, 8=0.0%, 16=0.0%, 32=0.1%, 64=0.0%, >=64=0.0%
issued rwts: total=10456193,0,0,0 short=0,0,0,0 dropped=0,0,0,0
latency : target=0, window=0, percentile=100.00%, depth=32

Run status group 0 (all jobs):
READ: bw=681MiB/s (714MB/s), 681MiB/s-681MiB/s (714MB/s-714MB/s), io=39.9GiB (42.8GB), run=60008-60008msec

Disk stats (read/write):
sdb: ios=1489948/0, merge=10/0, ticks=12879145/0, in_queue=10228592, util=99.85%
sdc: ios=1490311/0, merge=0/0, ticks=922770/0, in_queue=22108, util=99.41%
sdd: ios=1490078/0, merge=7/0, ticks=9530967/0, in_queue=6992564, util=99.42%
sde: ios=1490308/0, merge=0/0, ticks=537624/0, in_queue=8, util=99.48%
sdf: ios=1490288/0, merge=9/0, ticks=10328780/0, in_queue=7750484, util=99.43%
sdg: ios=1490305/0, merge=0/0, ticks=932092/0, in_queue=26688, util=99.45%
sdi: ios=1490132/0, merge=8/0, ticks=10470841/0, in_queue=7889748, util=99.45%

footer-logo

© 2024 - All Rights Reserved - NGX Storage